Account management tool with a consultative twist
Advanced analytics for sustaining and improving restaurant efficiency.
The challenge
Seating around 15 million diners per month through an industry-leading online restaurant reservation system, the business sought a mobile application that provides sales teams the ability to meet with restaurant owners, and provide compelling data that can convert new customers.
Additionally, these sales teams needed to be equipped with information that helps sustain and improve restaurant efficiency for existing customers, allowing them to show restaurant owners how changes in their operations can yield dramatic results.
The solution
By providing account representatives easy access to complex data, and equipping them with the controls to manipulate the data, the bearer of the application is instantly positioned as a subject matter expert with deep thought leadership of the industry and domain. In doing so, face-to-face meetings with restaurant owners become more consultative in nature, and substantially less “salesy”.
The data itself is deeply granular, allowing account representatives to direct conversations around extremely tactical storypoints, like diner party sizes or average capacity by time of day.
UX objectives
- Present data in a way that is easily explored by account representatives and easily understood by restaurant owners.
- Use natural human language to establish strategic “takeaway” messages within the application.
- Equip account representatives with the tools needed to be industry experts without being pushy.
- Data should be presented in a way that demonstrates compelling storypoints, while still appearing matter-of-fact in nature, with no persuasive agenda.
Project details
The project was a multi-week consulting engagement, working out of the client’s Los Angeles office in downtown Hollywood. The initial team consisted of a solutions architect, a project manager, and myself, utilizing the client-as-a-partner engagement model to conceptualize the application from the ground up. A series of workshopping sessions involved deep analysis into an existing field sales mobile application that was already in place, identifying gaps in its capabilities, and outlining requirements for the “in a perfect world” solution the sales team deserved.
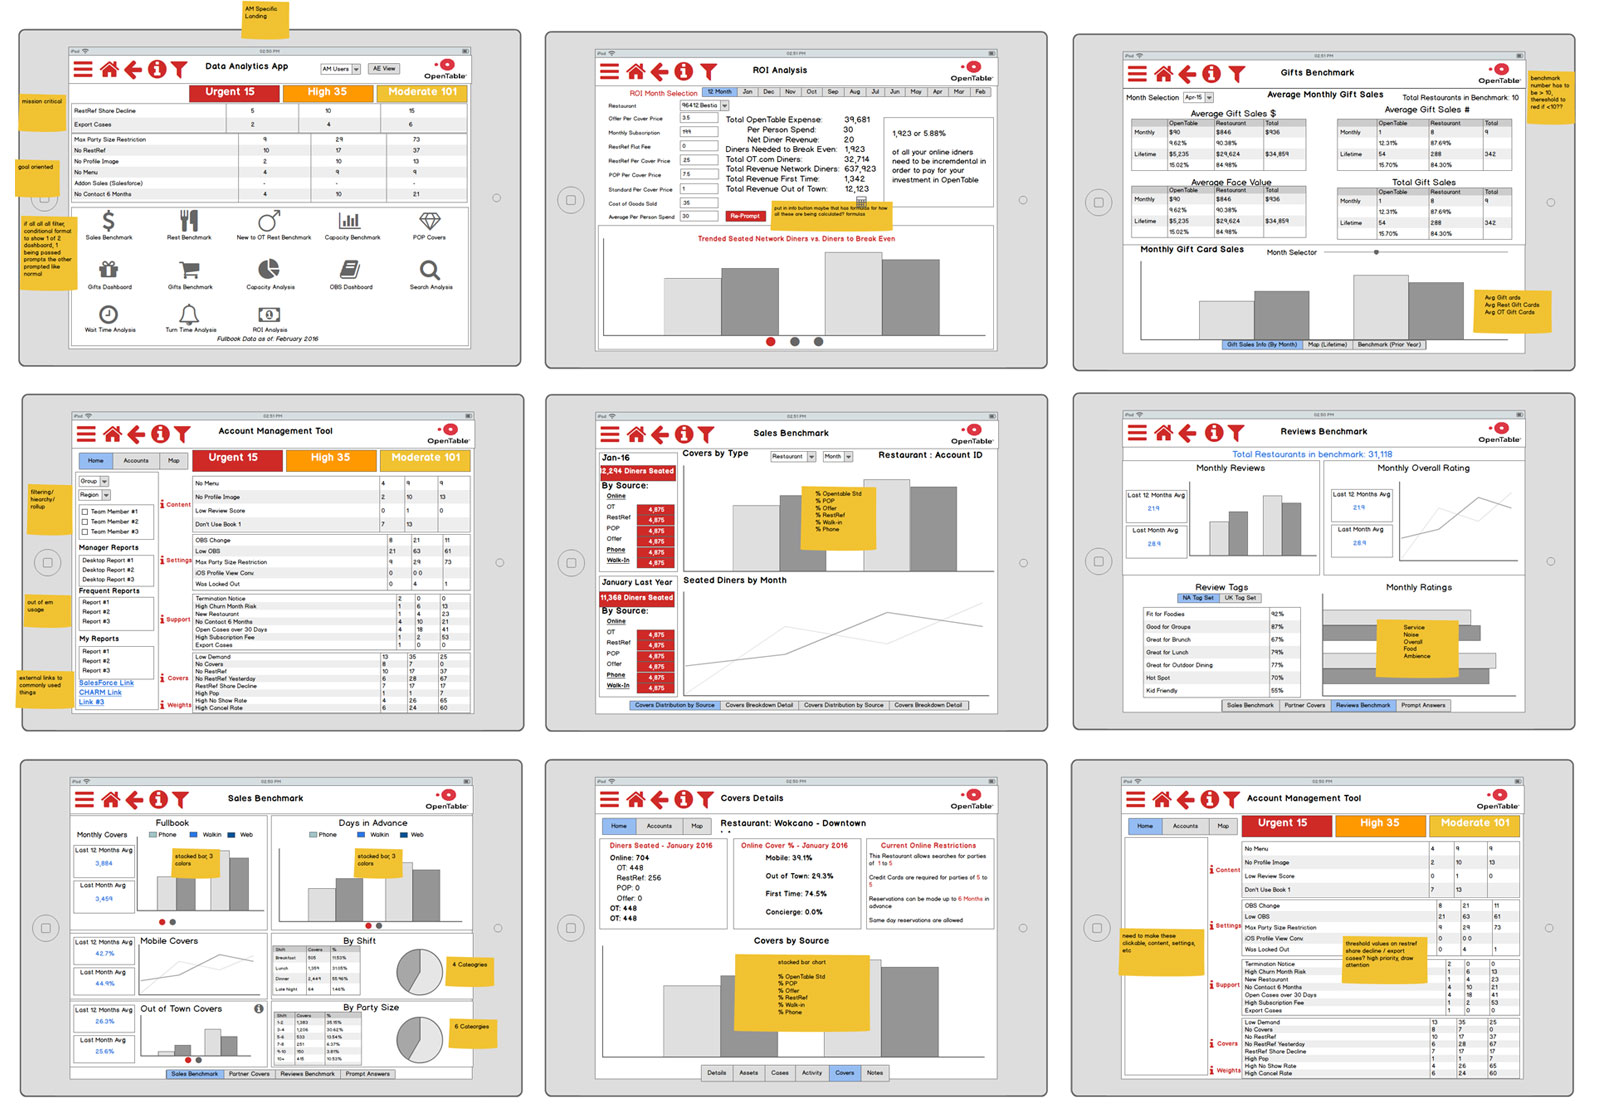
Process
For a company of around 700 people, of which, around 400 are in a sales-type function, getting this valuable sales tool right was critical. Preliminary user research was conducted via in-person interviews with people within each identified persona group (account executives, account managers, salespeople, installers, etc), to gain a deep understanding of what a face-to-face meeting with a restaurant owner might look like, what kinds of questions come up, what resources are needed to answer them, and what sort of data leaves them speechless.
In order to maximize the impact of the client team’s availability, while rapidly iterating on working prototypes, the team hosted daily ideation and solutioning workshops, where concepts were user tested with a target audience of persona representatives.
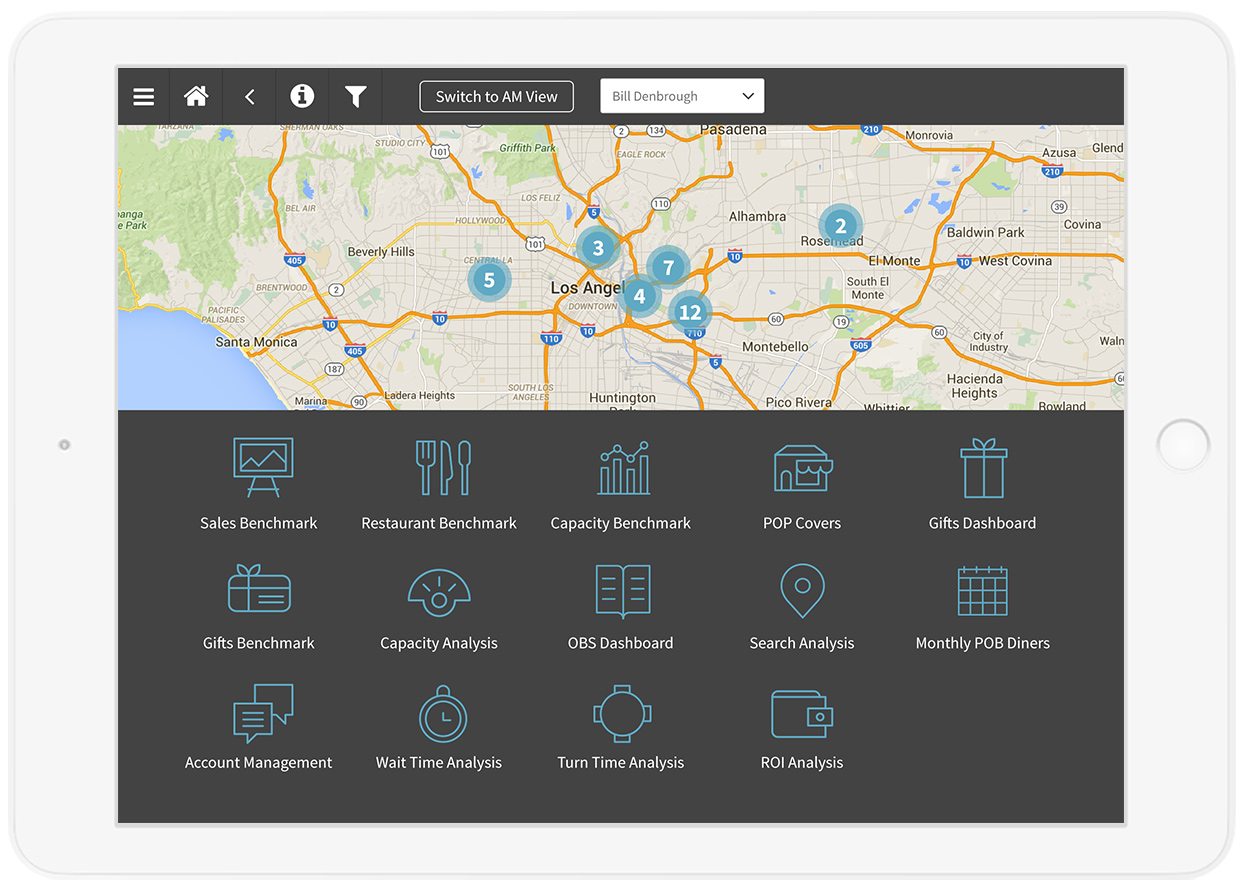
Localized views
An important discovery that came out of user interviews was that account managers would be using the tool proactively. In other words, they wanted to be able to visit a local neighborhood and identify opportunities for field sales while they’re in the area, using other restaurants in the area as a benchmark.
This provided a great opportunity to incorporate geo-fencing to localize the data. When the app is launched, the location is recognized, a map of opportunities are centered on the current location, and a benchmarking group of nearby restaurants is selected.
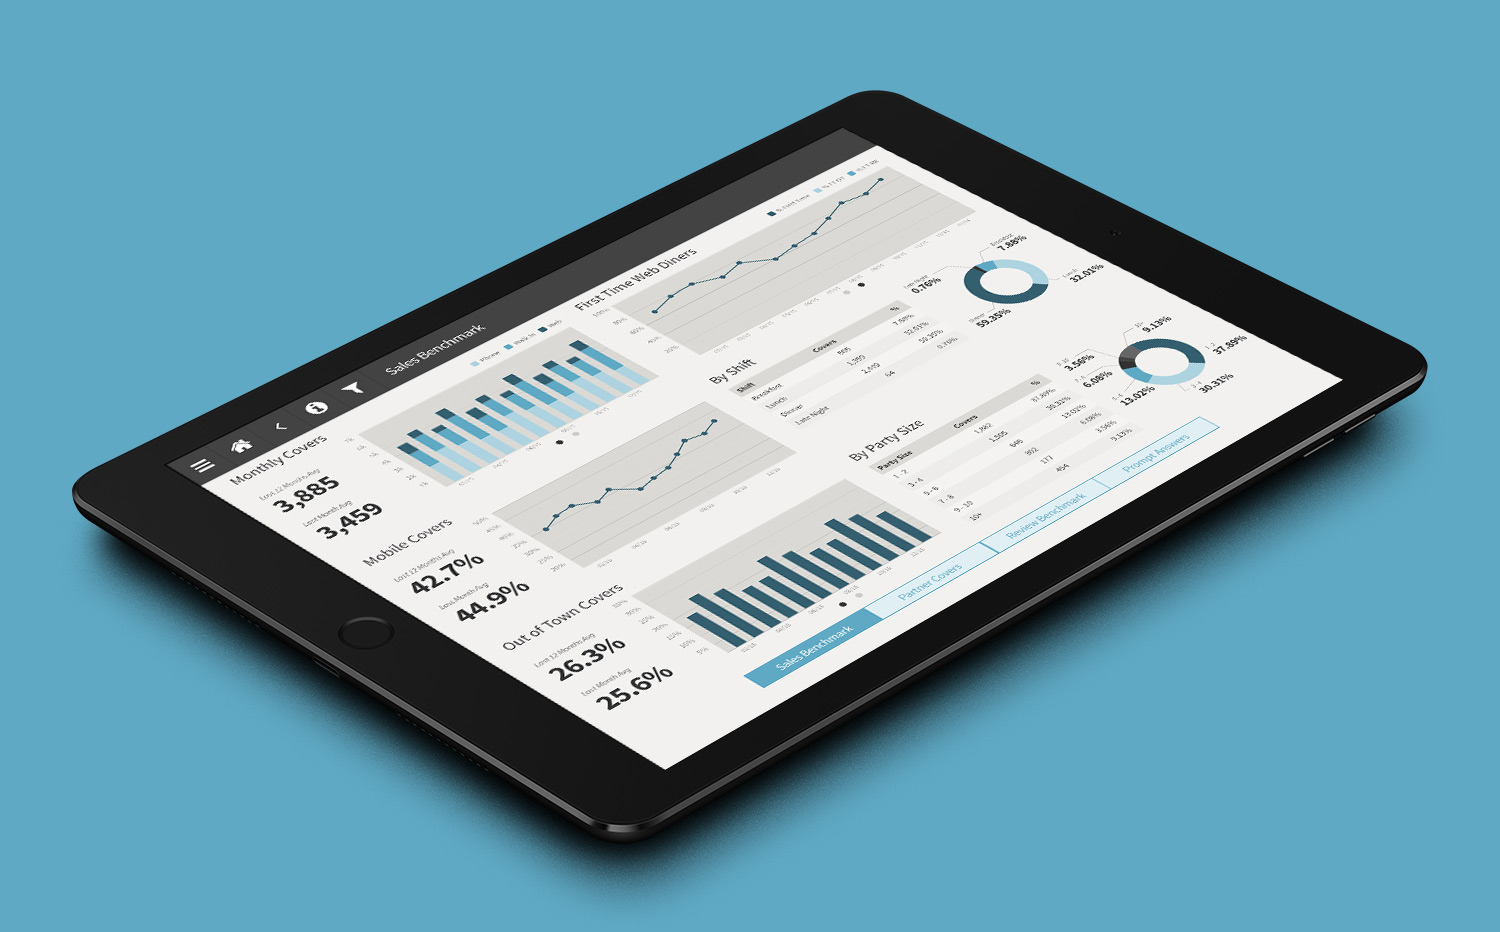
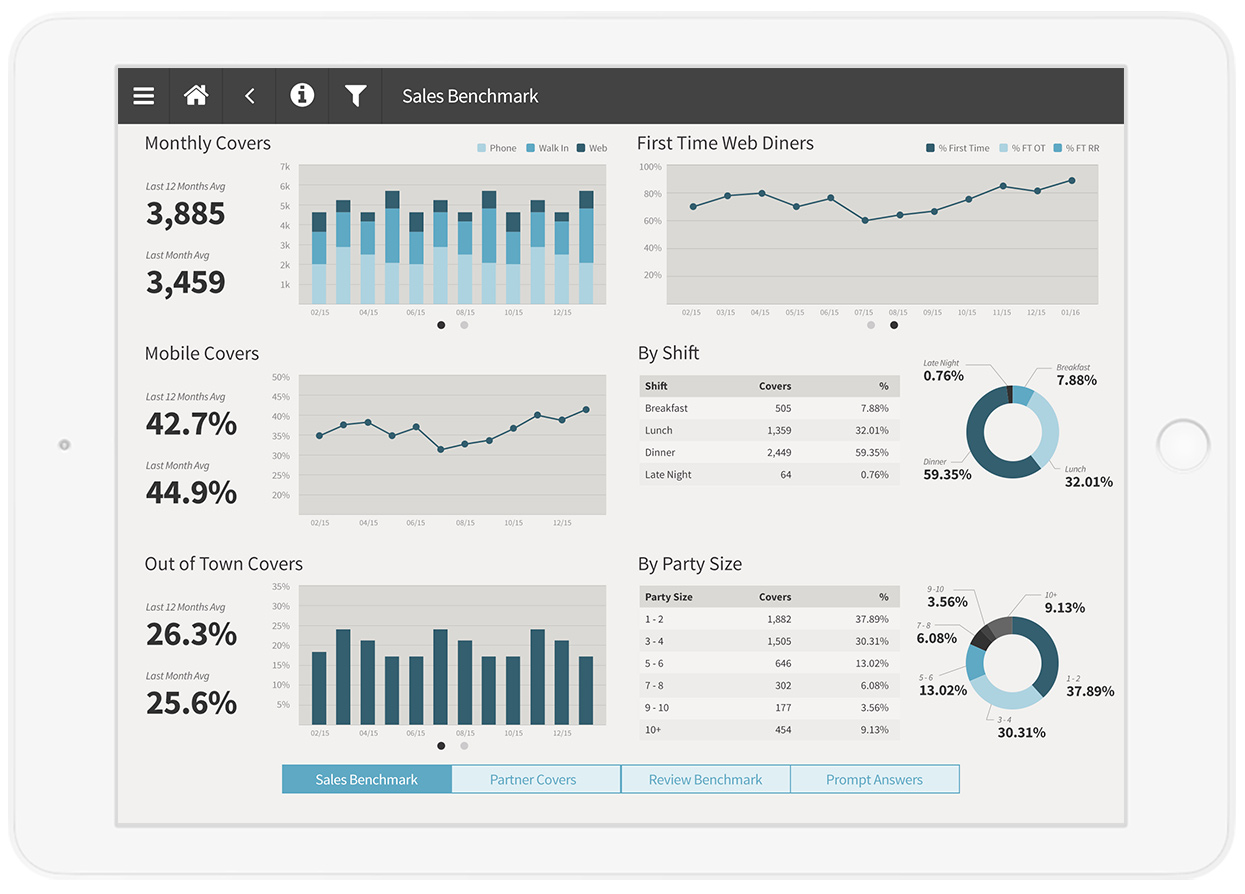
Benchmarking
To demonstrate the power of the network during field sales meetings, the application includes a localized benchmarking feature, where aggregated metrics of similar restaurants in the immediate area are presented as a breakdown of trends for key metrics over the last 12 months, with comparisons between the prior month average and the prior year average.
This makes for compelling storypoints during in-person meetings, where account managers are able to demonstrate with live data that not only does the platform work, but it’s working right now for other restaurants in the area.
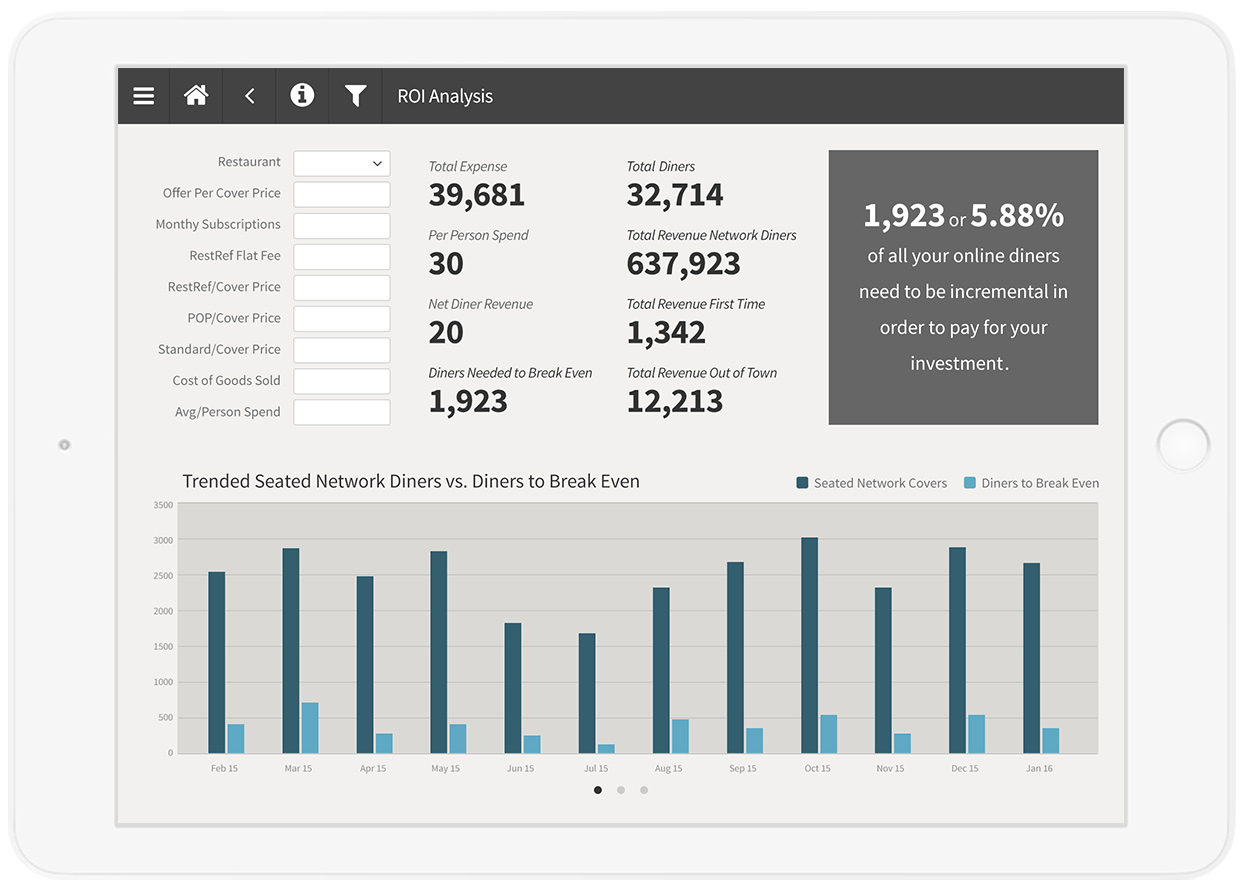
ROI Analysis
User interviews revealed that field sales meetings in this industry almost always came down to one simple thing: the bottom line. This valuable piece of information identified a major opportunity to include a compelling conversion mechanism as a final story point – an ROI analysis.
By completing a simple worksheet with the restaurant owner, account managers are able to demonstrate the potential for a return on investment. By comparing the number of reservations required per month to break even on the investment with the sheer volume of localized platform users in the immediate area over the last 12 months, the ROI potential becomes immediately apparent.